
Cape Grim Baseline Air Pollution Station

Cape Grim, on Tasmania’s west coast, is one of the three premier Baseline Air Pollution Stations in the World Meteorological Organization-Global Atmosphere Watch (WMO-GAW) network. Baseline stations are defined by the WMO to meet a specific set of criteria for measuring greenhouse and ozone depleting gases and aerosols in clean air environments.
These baseline stations are crucial points of reference for the larger global network of atmospheric gas observing stations.
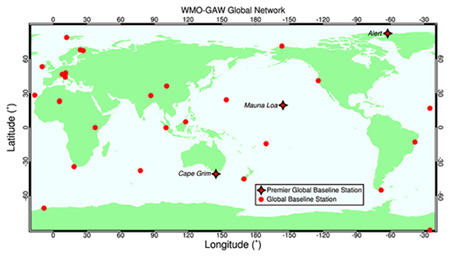
The Cape Grim Baseline Air Pollution Station monitors Southern Hemispheric air. In the Northern Hemisphere, the Mauna Loa Observatory in Hawaii has been continuously monitoring and collecting data related to atmospheric change since the 1950s.
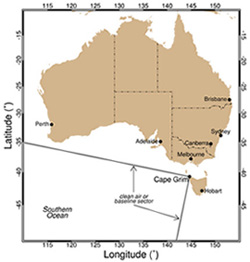
The Cape Grim station is positioned just south of the isolated north-west tip (Woolnorth Point) of Tasmania. It is in an important site, as the air sampled arrives at Cape Grim after long trajectories over the Southern Ocean, under conditions described as ‘baseline’. This baseline air is representative of a large area of the Southern Hemisphere, unaffected by regional pollution sources (there are no nearby cities or industry that would contaminate the air quality).
History
The Cape Grim program originated from a commitment by the Australian Government to the United Nations Environment Program in the early 1970s to monitor and study global atmospheric composition for climate change purposes. As a result, the Cape Grim Baseline Air Pollution Station first began measuring the composition of the atmosphere in April 1976 and has been in continuous operation since that date.
Cape Grim is a joint responsibility of the Bureau of Meteorology and the Commonwealth Scientific and Industrial Research Organisation (CSIRO). The Bureau of Meteorology funds and operates the Cape Grim atmospheric observational facility. CSIRO analyses and models the resultant data, which are made available to interested parties – Australian government agencies, industry, the public and international agencies.
What is measured?
Air samples are analysed at the station to determine concentrations of greenhouse and ozone-depleting gases, other air pollutants, including aerosols and reactive gases, and radon.
Also measured are weather and climate indicators like wind speed and direction, rainfall, temperature, humidity and solar radiation.
Since sampling began at Cape Grim, more that 3 billion measurements have been taken. Among these are measurements of greenhouse gases (GHGs), including carbon dioxide (CO2), methane (CH4), nitrous oxide (N2O) and synthetic GHGs such as hydrofluorocarbons (HFCs), perfluorocarbons (PFCs) and sulfur hexafluoride (SF6).
| Formula/Acronym | Gases |
|---|---|
| CO2 | carbon dioxide |
| CH4 | methane |
| N2O | nitrous oxide |
| CFC | chlorofluorocarbon |
| HFC | hydrofluorocarbon |
| PFC | perfluorocarbon |
| SF6 | sulfur hexafluoride |
| ODS | ozone depleting substances |
| GHG | greenhouse gas |
Chemicals which deplete the ozone layer are also measured, for example chlorofluorocarbons (CFCs) and halons, which are themselves potent GHGs. The number of atmospheric greenhouse gases measured at Cape Grim now exceeds 50, as well as concentrations of natural and anthropogenic aerosols (particles such as sea salt, mineral dust, carbon particles etc).
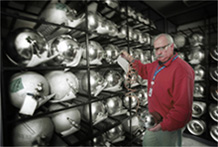
Some of the air samples collected at Cape Grim have been archived for further analyses as required. The Cape Grim air archive commenced in 1978 and is invaluable in determining the past atmospheric composition of a wide range of gases. For some of these gases, accurate and precise analytical methods have only recently evolved (for example HFCs and PFCs).
The measurements are state-of-the-art in precision and accuracy. They are used to identify trace gas trends in the Southern Hemisphere, which in turn can be used to drive climate change models and identify processes that influence changes to the atmosphere.
Changes in the air
Most GHGs (for example carbon dioxide, nitrous oxide, HFCs, PFCs, sulfur hexafluoride) have shown continuous increases in concentration since the mid-to-late 1970s. The growth of some GHGs (for example methane) has slowed recently and some are in decline (CFCs and halons for example).
Since the station first began measurements in 1976, carbon dioxide levels have increased by more than 15 per cent.
Concentrations of methane and nitrous oxide at Cape Grim have also increased significantly since 1978 by about 20 and 8 per cent respectively.
These increases are mostly likely caused by human activities such as fossil fuel consumption and various agricultural practices.
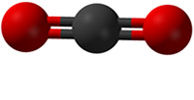
Carbon dioxide
Measurement
Carbon dioxide concentrations in air are measured using Non-Dispersive Infrared (NDIR) gas analysers. These instruments can detect the concentration of carbon dioxide by measuring the amount infrared radiation absorbed by an air sample compared to a reference or calibration air sample. Carbon dioxide can also be measured using a gas chromatograph (GC), by first converting the carbon dioxide to methane, and then measuring the methane with a flame ionisation detector (FID) (see below).
Seasonal variation
Carbon dioxide concentrations show seasonal variations (annual cycles) that vary according to global location and altitude. Several processes contribute to carbon dioxide annual cycles: for example, uptake and release of carbon dioxide by terrestrial plants and the oceans, and the transport of carbon dioxide around the globe from source regions (the Northern Hemisphere is a net source of carbon dioxide, the Southern Hemisphere a net sink).
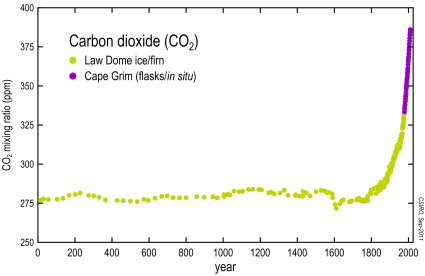
The Cape Grim baseline carbon dioxide data displayed show both the annual cycle and the long-term trend.
Inter-annual variability
As well as the obvious seasonal variations and long-term trends in carbon dioxide concentrations, there are also more subtle variations, which have been shown to correlate significantly with the regular El Niño-Southern Oscillation (ENSO) phenomenon and with major volcanic eruptions. These variations in carbon dioxide are small compared to the regular annual cycle, but can make a difference to the observed year-by-year increase in carbon dioxide.
Comparison to pre-industrial concentrations
Carbon dioxide concentrations in the air were reasonably stable (typically quoted as 278 ppm) before industrialisation (in the timeframe of human existence).
Since industrialisation (typically measured from the mid-18th century), carbon dioxide concentrations have increased by about 40 per cent, based on measurements from Cape Grim and on air samples collected from Antarctic ice at Law Dome.
Concentrations
Dry air is composed of nitrogen (78 per cent), oxygen (21per cent) and other gases, such as argon, carbon dioxide, methane, hydrogen, nitrous oxide etc, which make up the remaining 1 per cent.
Carbon dioxide is measured in parts per million molar (ppm) – the 2009 global mean carbon dioxide level was 386 ppm. If you have a sample of dry air, made up of 1 million molecules, 386 would be carbon dioxide molecules.
Methane
Measurement
Methane concentrations in air are analysed using a gas chromatograph (GC) equipped with a flame ionisation detector (FID). The GC separates the air into its various components and the FID uses a hydrogen flame to ionize components such as methane, which are then detected as a disturbance to an applied voltage field.
Comparison to pre-industrial concentrations
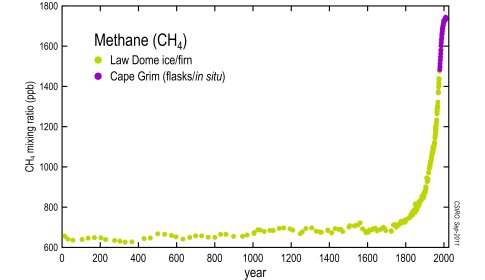
Methane concentrations in the air were reasonably stable before industrialisation (in the timeframe of human existence) typically quoted as 700 ppb (parts per billion molar).
Since industrialisation, methane concentrations have increased by more than 150 per cent to present day values (~1790 ppb in 2009).
Trends
Methane has increased in the global atmosphere due to a variety of agricultural practices, such as rice and cattle farming, as well as from the mining of coal, the mining and reticulation of natural gas and possibly increased emissions from wetlands in response to global temperature increases.
The long-term upward trend in methane levels has slowed in recent years as the atmosphere appears to be approaching equilibrium with global methane sources, some of which have stabilised or reduced (natural gas leakage). GHG emission scenarios (estimates of future methane emissions) suggest that methane levels will increase again in the near future.
Seasonal variations
Methane concentrations show seasonal variations (annual cycles) that vary according to global location and altitude. The major processes that contribute to methane annual cycles are:
- release from wetlands, dependant on temperature and rainfall;
- destruction in the atmosphere by hydroxyl radicals;
- transport of methane around the globe from source regions (the Northern Hemisphere is a net source of methane, the Southern Hemisphere a net sink).
The baseline methane data displayed here from Cape Grim show both the annual cycle and the long-term trend.
Inter-annual variability
As with carbon dioxide, there are the more subtle inter-annual variations in methane, which have been shown to correlate with the regular ENSO phenomenon and with major volcanic eruptions. These variations in methane are small compared to the regular annual cycle, but can make a difference to the observed year-by-year annual increase.
Concentrations
Methane is measured in parts per billion molar. The 2009 global mean level was about 1790 ppb. If you had a sample of air, made up of 1 billion molecules, 1790 of those would be methane molecules.
Nitrous oxide
Measurement
Nitrous oxide concentrations in air are measured using a GC equipped with an electron capture detector (ECD). Electrons from a radioactive source in the ECD ionize molecules like nitrous oxide, which interfere with the standing current of the detector generated from the ionisation of a carrier gas such as nitrogen and/or argon. The change in current indicates the amount of nitrous oxide in the sample.
Comparison to pre-industrial concentrations
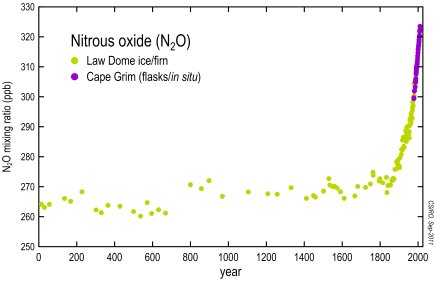
Nitrous oxide concentrations in the air were reasonably stable before industrialisation (in the timeframe of human existence), typically quoted as 270 ppb (parts per billion molar). Since industrialisation, nitrous oxide concentrations have increased by about 20 per cent to present day values (~323 ppb in 2009).
Trends
Nitrous oxide has increased in the global atmosphere due to agricultural/land-use practices (for example the use of nitrogenous fertilisers).
Seasonal variations
Nitrous oxide concentrations show relatively-weak seasonal variations (annual cycles) that vary according to global location and altitude. The major processes that contribute to nitrous oxide annual cycles include:
- natural, seasonal releases from the ocean;
- exchange of air with the stratosphere where most nitrous oxide is destroyed; and
- transport of nitrous around the globe from source regions (the Northern Hemisphere is a net source of nitrous oxide, the Southern Hemisphere a net sink).
The baseline nitrous oxide data displayed here from Cape Grim show both the annual cycle and the long-term trend.
Concentrations
Nitrous oxide is measured in parts per billion. The 2009 global mean level was about 323 ppb. If you had a sample of air, made of 1 billion molecules, 323 of those would be nitrous oxide.
Terms of Use
-
Terminology
Content means the content of the site [https://csiro.au/greenhouse-gases] including but not limited to, data, information, databases, images and material.
you/user means you as a website user, or Content/data user.
-
Using Content
CSIRO reserves the right to make corrections, revisions, updates and improvements to any Content on this site but is under no obligation to do so.
Without limiting the foregoing, the most recent year of data is provided in this site on a provisional basis only and may be subject to further revision.
If you use or download Content from this site, you acknowledge that such Content:
- may contain statements based on scientific research and comprises data collected by CSIRO and third parties;
- is not professional, scientific, medical, technical or expert advice and is subject to the usual uncertainties of advanced scientific and technical research;
- should not be relied upon as the basis for doing or failing to do something.
References or links to third party data are provided for information and convenience only and do not mean that CSIRO endorses or approves that data.
Any use of the Content must acknowledge the source of the Information as CSIRO Marine and Atmospheric Research and the Australian Bureau of Meteorology (Cape Grim Baseline Air Pollution Station) and include a statement that CSIRO and the Australian Bureau of Meteorology give no warranty regarding the accuracy, completeness, currency or suitability for any particular purpose and accept no liability in respect of data.
The Content on this site must not be distributed or disseminated to third parties without the attachment of the Terms of Use.
-
Grant of licence
CSIRO grants you a royalty-free, non-exclusive, non-transferable licence to use, reproduce, adapt or communicate the Content on this site for any purpose other than a commercial purpose. For the purposes of this licence, commercial purpose means to sell, hire, exchange or otherwise exploit the Content (whether in its original or adapted form, or incorporated in products or services) for profit or gain.
The rights granted under this licence are personal to the user and are not sub-licensable or capable of assignment.
-
Disclaimer
If you use or download any Content from this site you accept all risks and responsibility for losses, damages, costs and other consequences resulting directly or indirectly from using the Content.
To the maximum extent permitted by law, CSIRO excludes any and all liability to any person for any consequences, including but not limited to all losses, damages, costs, expenses and any other compensation, arising directly or indirectly from using the Content.
Every effort has been made to ensure the accuracy of the Content on this site, however CSIRO does not warrant the accuracy and reliability of the Content and, to the extent permitted by law, does not guarantee or make any express or implied representation regarding the accuracy, reliability, correctness, fitness for use for any purpose whatsoever of the Content. Any use and/or interpretation of the Content is done so entirely at the users own risk.
- Whole agreement
-
Use of this site is subject also to CSIROs Legal Notice and Disclaimer. By using this site and the Content available on and through it, you are agreeing to be bound by these Terms of Use and the Legal Notice and Disclaimer. If there is any conflict then these Terns of Use will prevail, but only to the extent that it applies to the particular Content and to the extent necessary to resolve any conflict.
-
CSIRO may change these Terms of Use at any time without giving you notice, so please check them each time you visit the site.
